Sondre is currently an affiliate of Harvard University’s Institute for Quantitative Social Science. He received his PhD from Princeton University in 2020. His academic publications and unpublished work can be found below, while his data journalism can be found here. He is also on Google Scholar.
Dissertation:
The Political Causes and Consequences of Technological Change. Department of Politics, Princeton University, 2020. Advisers: Helen V. Milner (chair), Carles Boix, Matias Iaryczower.
This dissertation explores the political causes and consequences of technological change. In three essays, I show that new technology and trade shape states’ economies, politics, and relations with each other. Click here for a 5-Page introduction (PDF)
Presented at University of Oxford (2020), Rutgers University (2019), the Princeton International Relations Faculty Colloquium (2018), and the Annual Meeting of the International Political Economy Society (“IPES” 2018). PDF (Replication)
Abstract: Do world politics affect the adoption of new technology? States overwhelmingly rely on technology invented abroad, and their differential intensity of technology use accounts for many of their differences in economic development. Much of the literature on technology adoption focuses on domestic conditions. The authors argue instead that the structure of the international system is critical because it affects the level of competition among states, which in turn affects leaders’ willingness to enact policies that speed technology adoption. Countries adopt new technology as they seek to avoid being vulnerable to attack or coercion by other countries. By systematically examining states’ adoption of technology over the past two hundred years, the authors find that countries adopt new technologies faster when the international system is less concentrated, that changes in systemic concentration have a temporally causal effect on technology adoption, and that government policies to promote technology adoption are related to concerns about rising international competition. A competitive international system is an important incentive for technological change and may underlie global technology waves.
Presented at the University of Oxford Political Economy of Finance Conference (2018), the Atlanta Conference on Science and Innovation Policy (2017), in the Princeton University Political Economy Colloquium (2017, 2019), and the Princeton University International Relations Colloquium (2016). PDF (Replication)
Abstract: How does economic opportunity – the set of possible investments in an economy – shape politics, and politics shape investment? I argue that in a world where money is power, political leaders will intervene in the economy if investment returns shift power and threaten their position. Anticipation of such action induces a bias towards investments which vary less and co-vary with the investments of the regime. Leaders will then weigh losses from such intervention and biased allocation, which depends on possible investments (their risk and covariance), with the costs of a larger and less vulnerable coalition. I provide casual evidence of this process using a revolution in transport technology – the steamship – which radically altered economic opportunity in the 19th century. I show that not only do large coalition regimes such as democracies have an inherent investment edge in high-risk projects, such as new technology and international trade, but that they are more likely to emerge if that is where economic opportunities are.
Working papers:
Does Globalization Bring Peace? A Study of Trade and Interstate War, 1845-1905. Presented in the Princeton University Political Economy Colloquium (2018), at the Midwest Political Science Association Annual Meeting (2018) and the Princeton University International Relations Colloquium (2017).
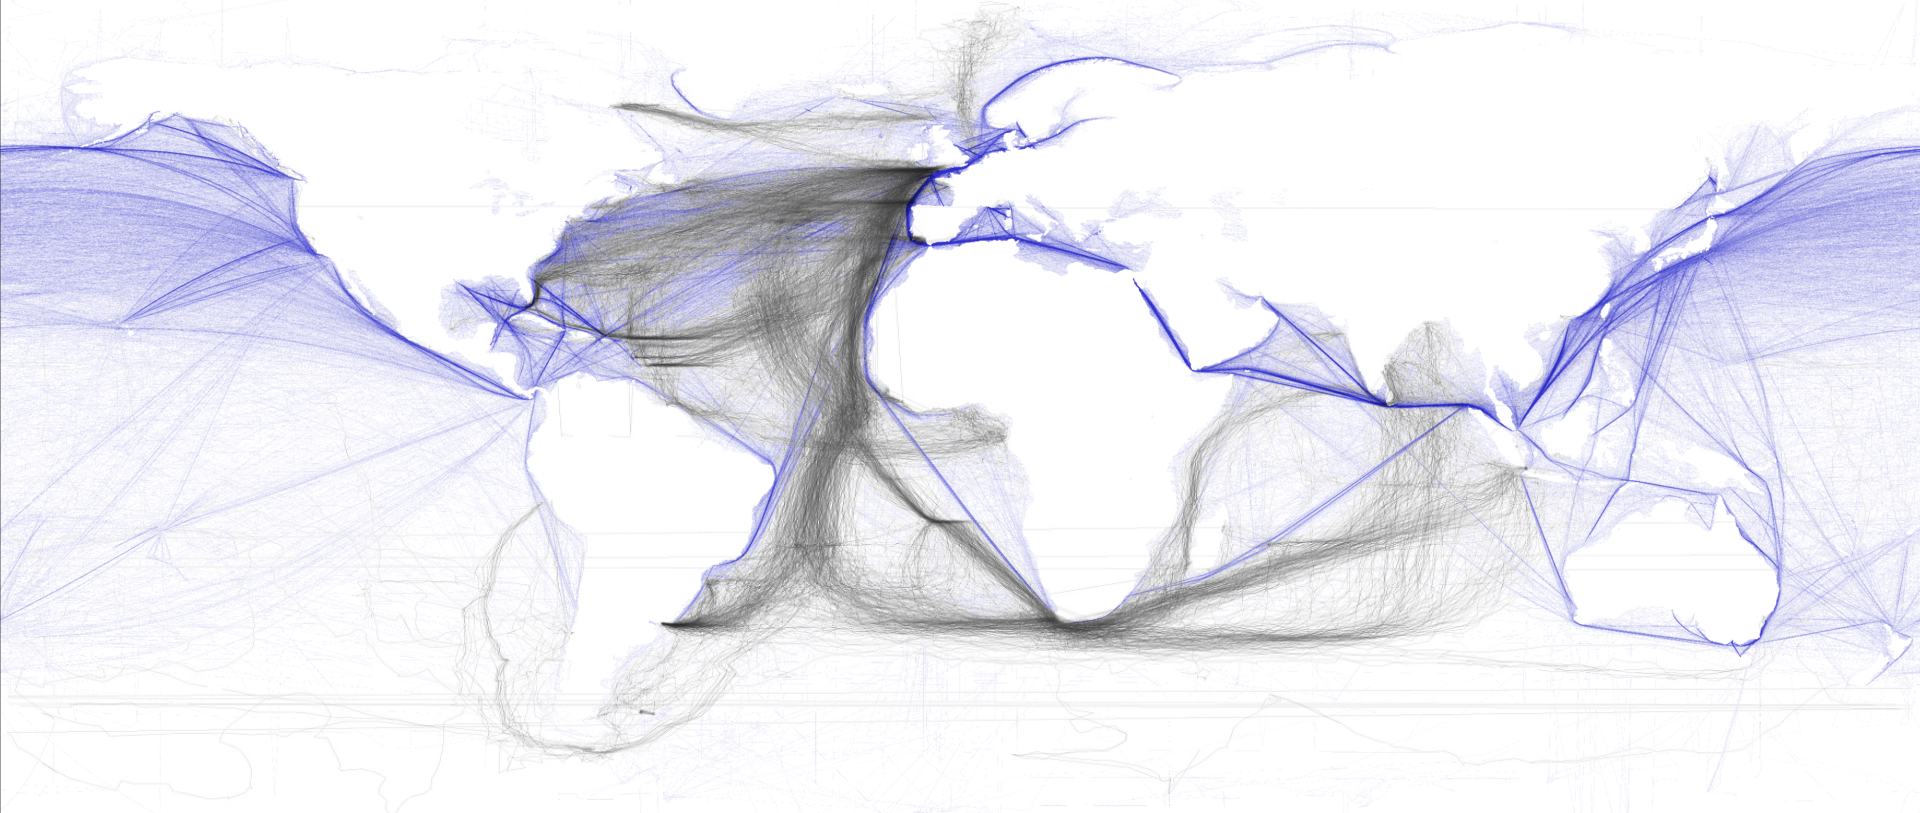
Abstract: Testing the link between trade and peace, both between and within countries, has so far been difficult due to the lack of a good instrument for trade. I leverage a novel instrument for trade – the change in effective shipping distances due to the invention and adoption of steam technology (Pascali 2017) – to study the relationship between increases in trade and countries’ propensity for conflict. I find that as countries trade more overall, the probability that they go to war goes down, in a relationship not driven by bilateral effects, and not present for civil war. This has implications both for our understanding of the first wave of globalization, and the one we are experiencing today: I provide evidence in favor of a “commercial peace” that is general, and not within or between particular states.
Sample of journeys by sail in 1750-1810 (black) versus shipping routes by modern propulsion (blue). Constructed using ship logs from Spain, France, the Netherlands and the United Kingdom (digitalized by the Climatological Database for the World’s Oceans project, some 200 000 positions), and modern propulsion ship routes from Halpern et al. (2008). I leverage the difference in port-to-port distances by sail and steam to construct an instrument for trade.
Trade, Technology, and Growth
Can progress arrive by container? I estimate the global adoption of shipping containers in oceanic trade, container and non-container shipping routes, and use the three to construct a novel instrument for trade in the post-1960 era. I use this instrument to assess if trade brought economic growth, and if so, the extent to which this growth can be attributed to increased technology use, technology innovation, economic specialization, democracy or peaceful international relations — and how trade can be related to these as outcomes in their own right. In so doing, I use and make accessible new data on technology innovation, port-to-port oceanic distances, and a novel measure of how economies change based on product-level trade composition. I find that trade brought growth, in part through increased technology use and innovation, changed economies, and peaceful economic relations.
All countries saw more trade as a result of containerization, but the impact was not the same for all countries. The animation shows how countries’ share of global trade changed in the years 1960-2015. Colors reflect a countries’ share of world trade relative to its share in 1995. Countries which got darker saw their share of world trade shrink, whereas countries which got lighter saw their share of trade grow.
Smart Social Networks: How AI-Curation Polarizes and Empowers Extremism in Online Communities
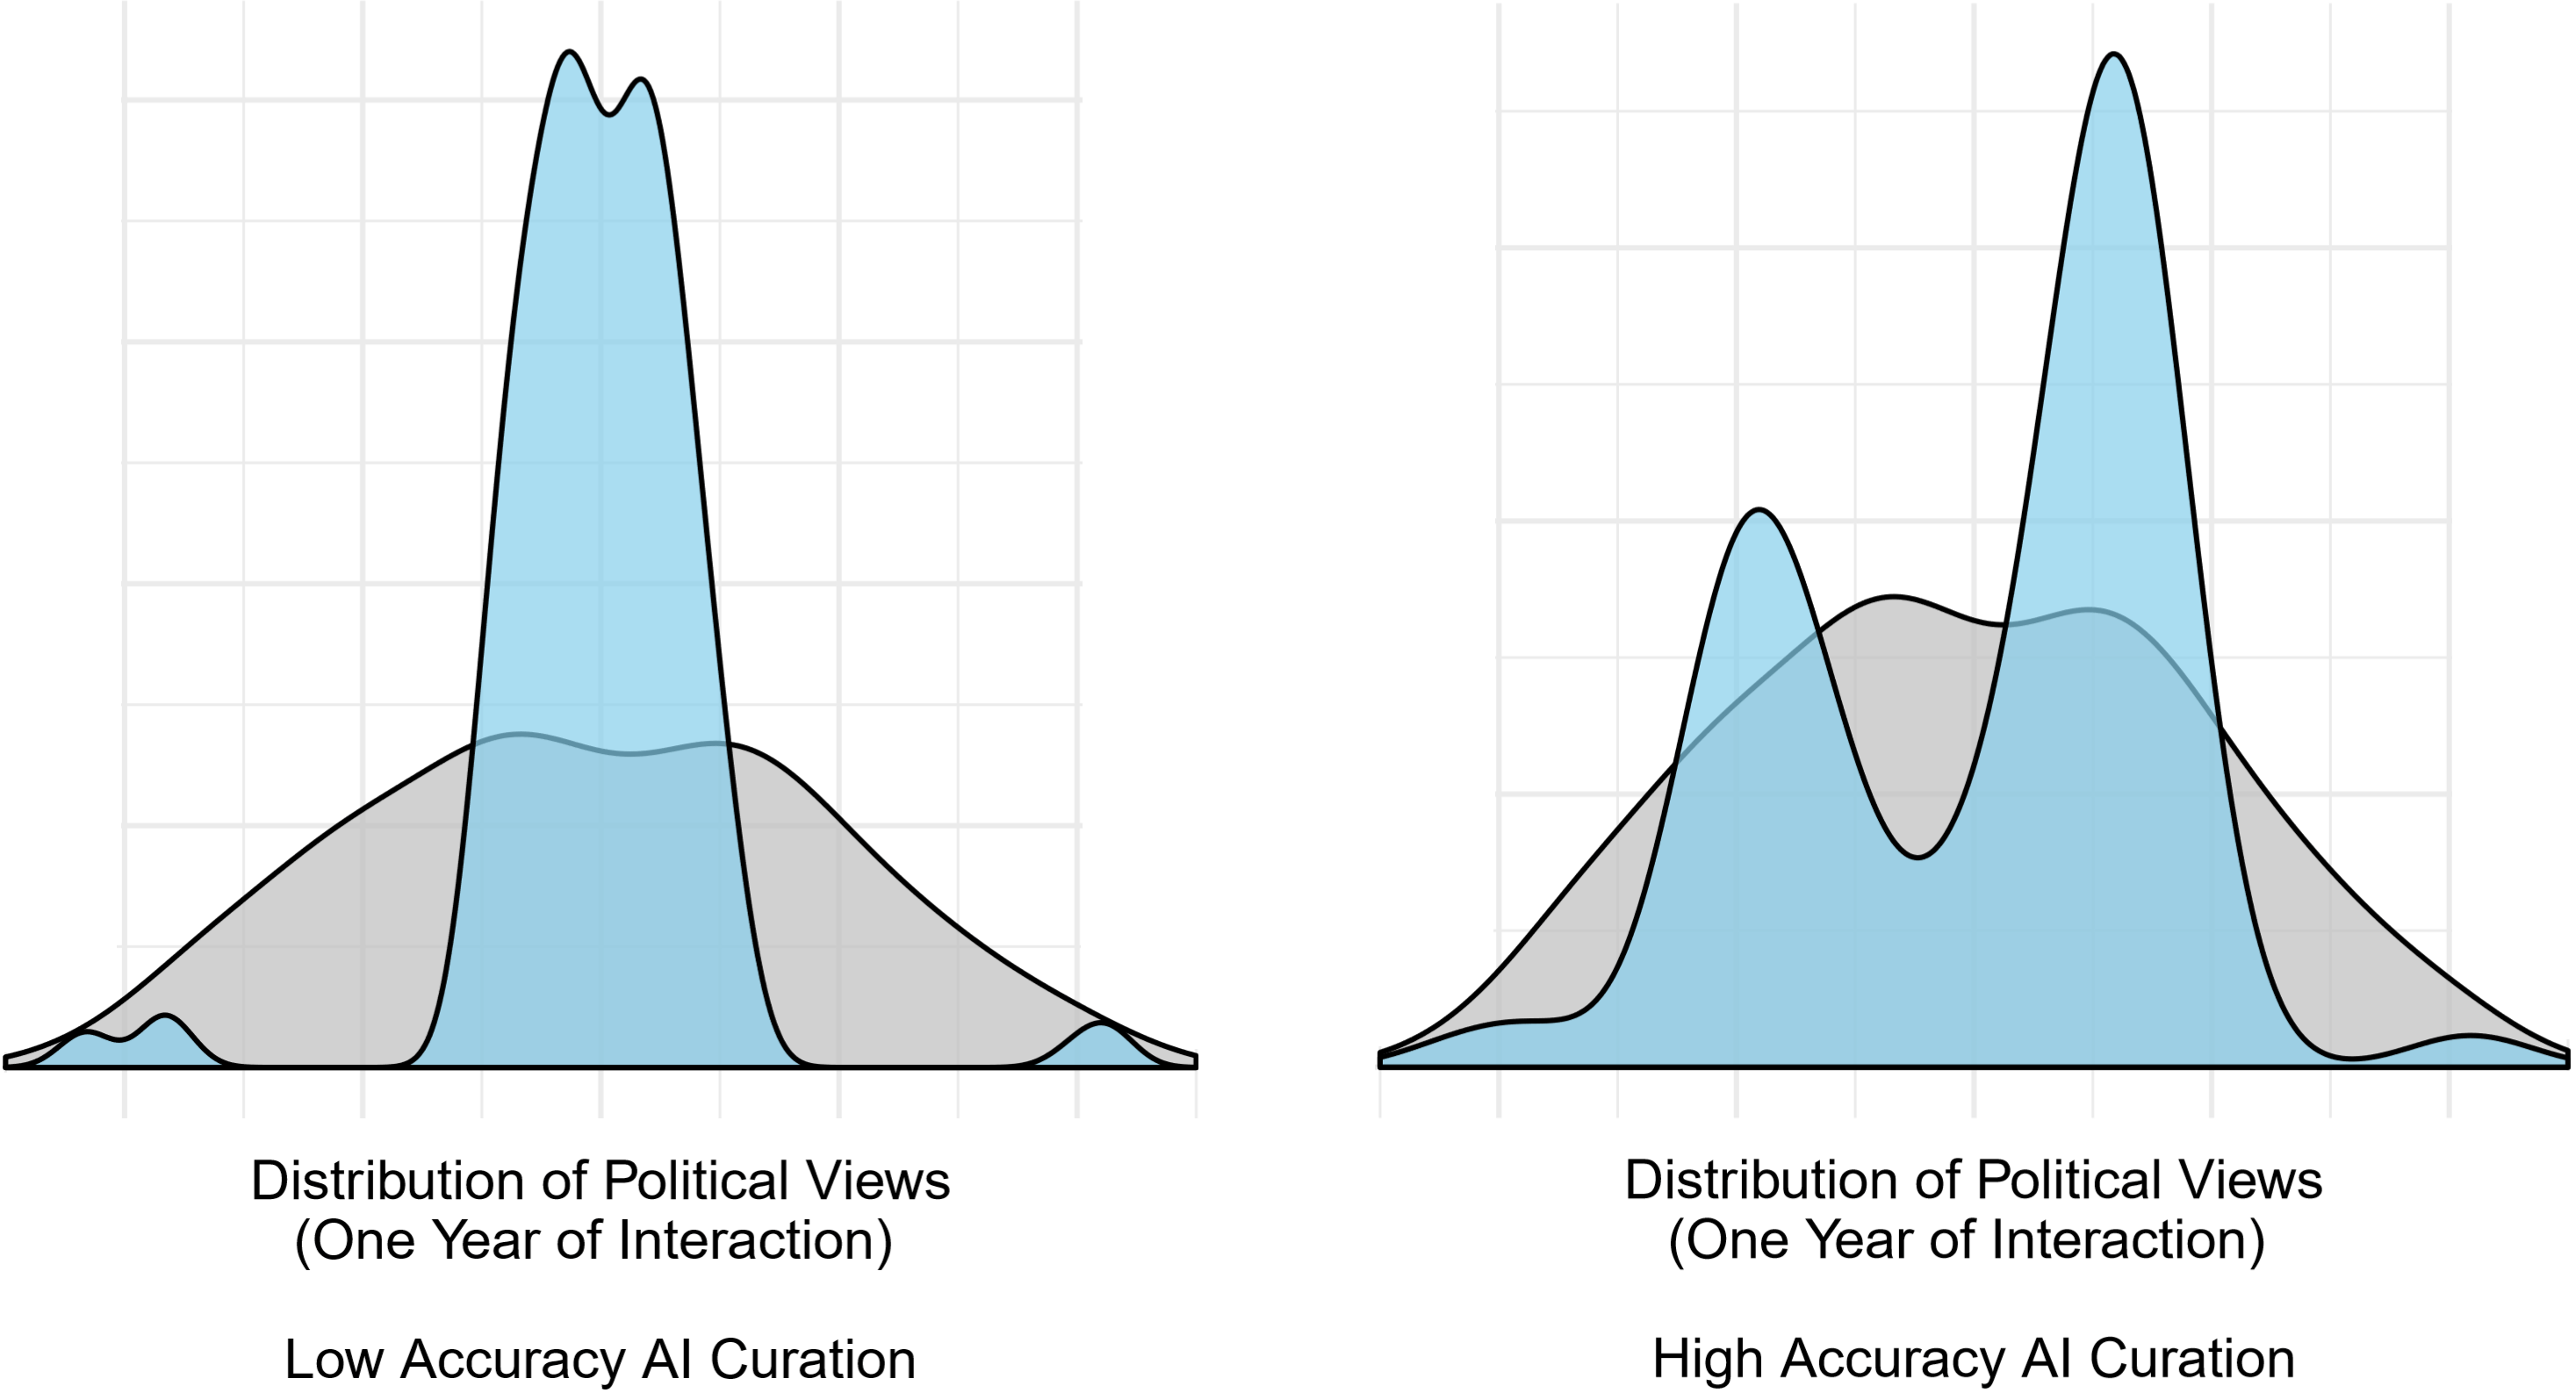
What are the consequences of AI curation for online communities? I build a simulation of a social media platform in which users have dynamic views, generate and share content based on these views, and an AI algorithm connects users with similar content. I find: (1) AI curation leads to view polarization, (2) these effects are magnified the more accurate the AI algorithm is, and (3) that more accurate AI-groupings make users who have views that are extreme and unchanging (trolls/extremists) have a higher impact. I assess the robustness of these findings using a range of AI grouping strategies, number of groups, users, starting views, and content generation procedures.
Shows starting views (gray) and views after one year of interaction on social media (blue), both on a right-left dimension. The plot builds on a novel computer simulation of a social media platform in which users generate and post content based on their views, this content is shared within groupings constructed by a machine learning algorithm, and users update their views based on the content they see. In the simulation presented here, another layer of complexity is added in that five percent of users are “extremists” – have views at either the far right or far left, and do not update their views. As seen, the more accurate the machine learning is, the more powerful these extremists and group dynamics become: rather than more interaction leading to agreement, it leads to polarization.
High Seas, High Stakes: The Importance of Open Waters
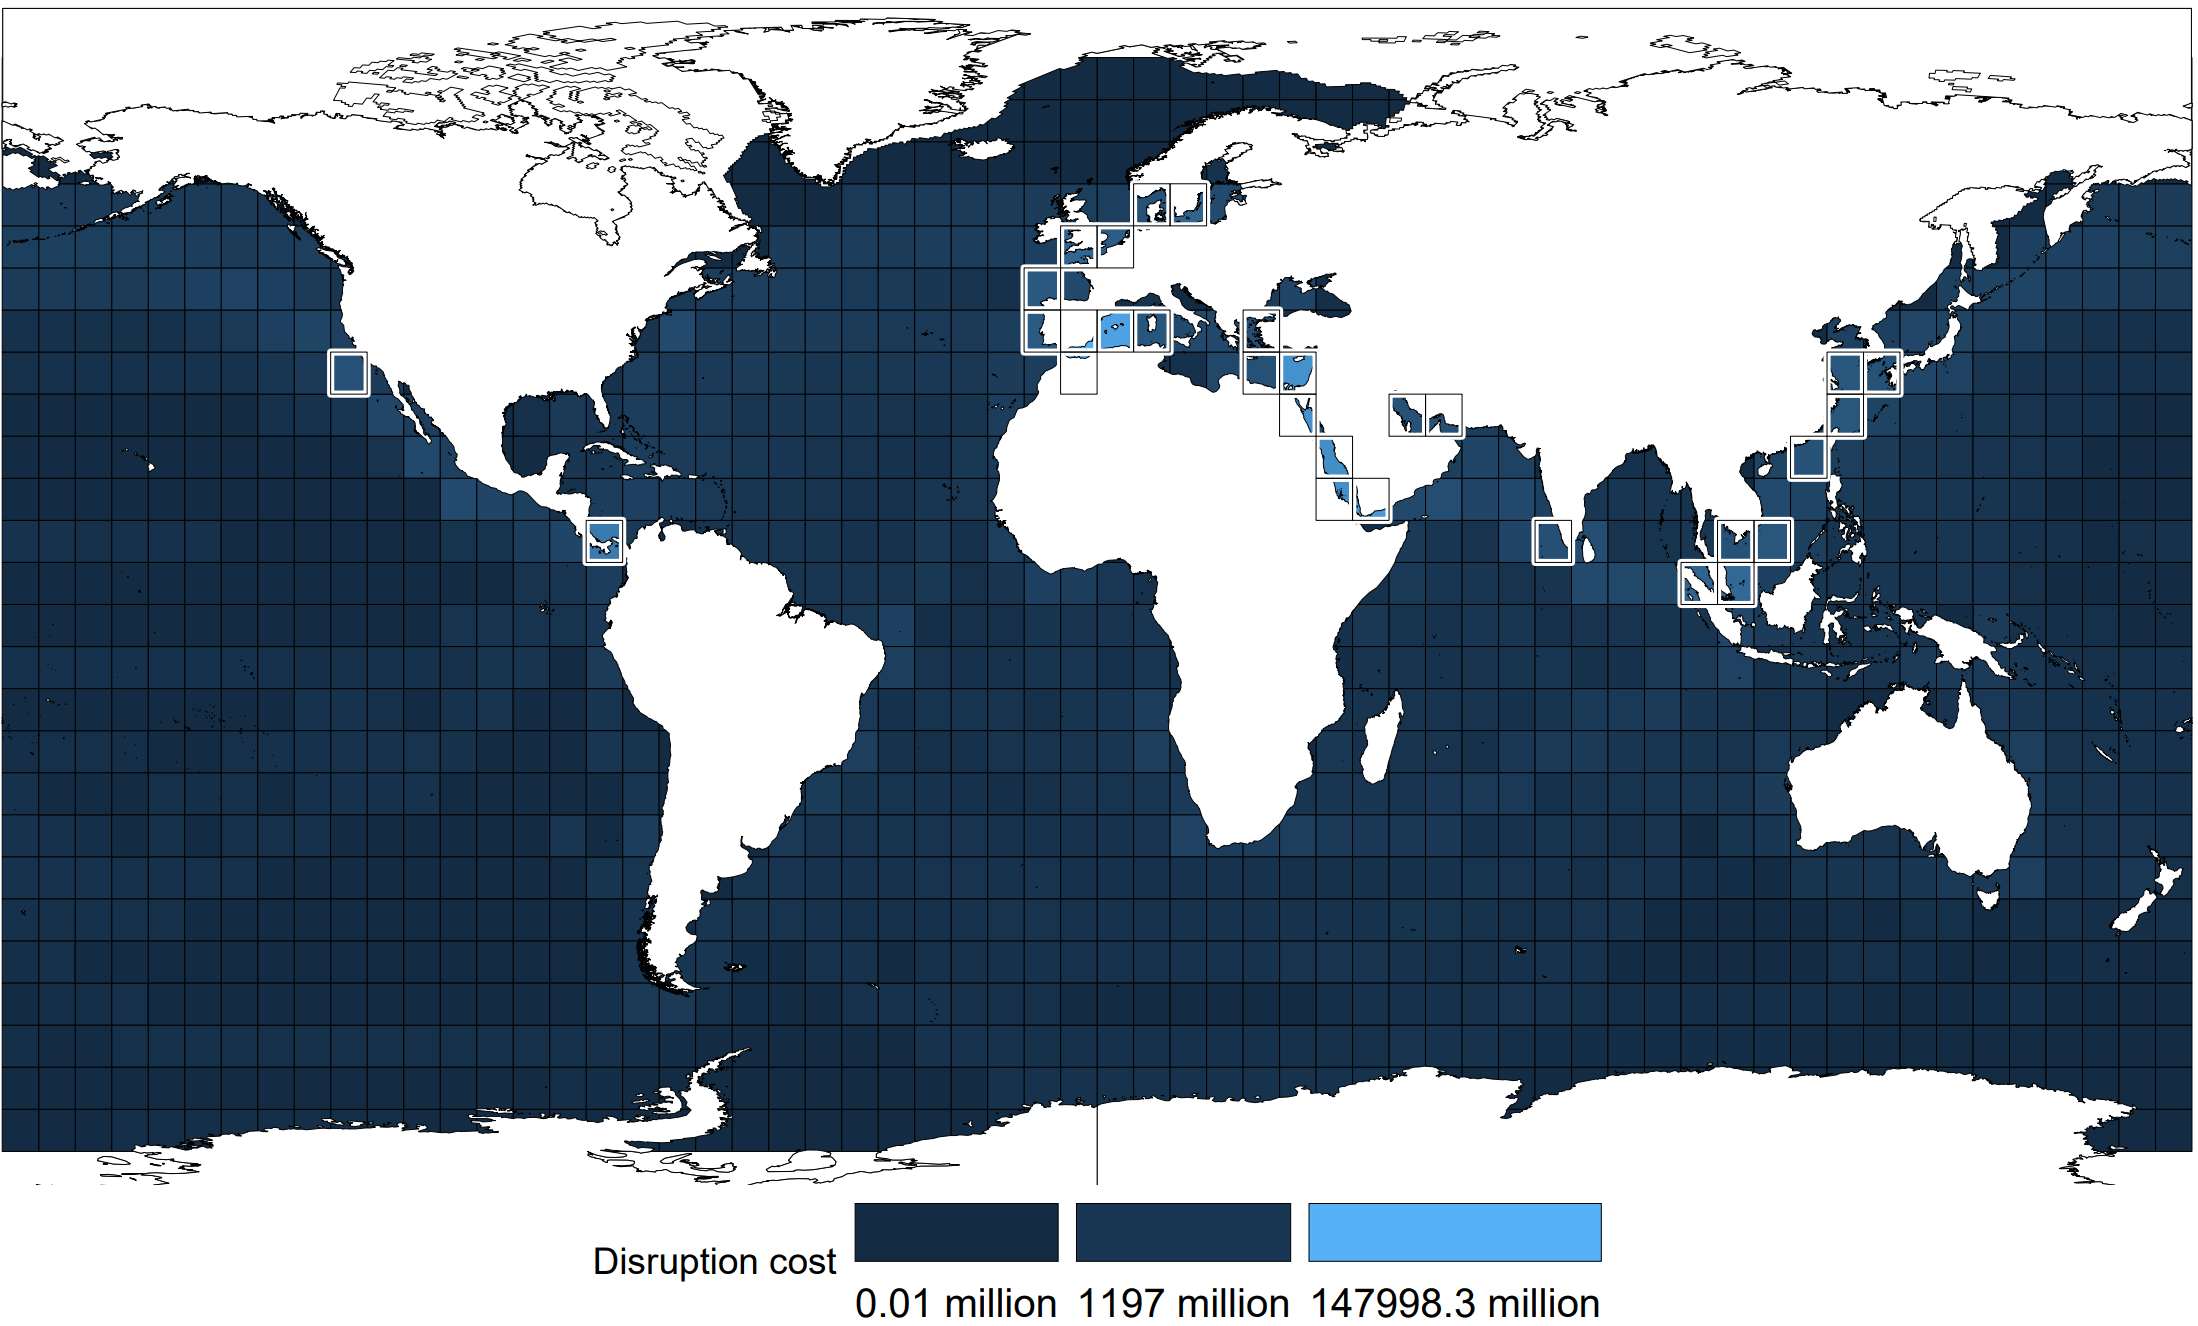
Abstract: More than 90 percent of international trade is carried by sea. How vulnerable is this trade – and the economic interdependence it enables – to disruption? Research on the vulnerability of international trade has been done at the country, region, or case basis. But disruption of international trade by war, terrorism, piracy or natural catastrophe tend to be in specific geographical – not political – areas. I estimate the economic value of unimpeded travel of all the world’s ocean areas at the 3 longitude times 3 latitude level. I here calculate how much disruption in each area – the area being closed to commerce – increases transportation costs, by calculating all optimal alternative ship routes. I also estimate the vulnerabilities of the United States, Japan and China in particular. I thus aim to contribute to the literature by: (1) identifying the world’s key arenas of contention from the perspective of controlling international commerce, (2) providing measures of the economic impact of a shutdown of specific ocean areas and choke-points, and (3) establishing a baseline estimate of several countries’ trade-flow vulnerabilities.
The top 30 ocean areas in terms of disruption cost are highlighted. Disruption costs are much higher at naval choke-points than in open waters, with the most crucial being the Strait of Gibraltar. The method employed here automatically “discovers” such choke-points (such as the Panama canal) as a consequence of comparing the lengths of ship routes between all ports calculated with and without access to the ocean area in question, and the value of traffic going between these ports. Dollar amounts are tentative, and based on all world trade in 2014.
Expertise: a Novel and Fast Approach to Machine Learning Extremization
I utilize theory from Satopaa et al (2016) to construct a new ensemble machine learning algorithm based on dynamic extremization. Offers very rapid convergence, estimates of information accessed, and near-unlimited parallellization.
The Soil of Politics: Resources, Competition, and the Consequences of Ethnic Inequality, with Rachael McLellan. Presented at the 4th Annual Conference of the History and Politics Network (2017), the Princeton Political Economy Colloquium (2017), and APSA (2016). PDF.
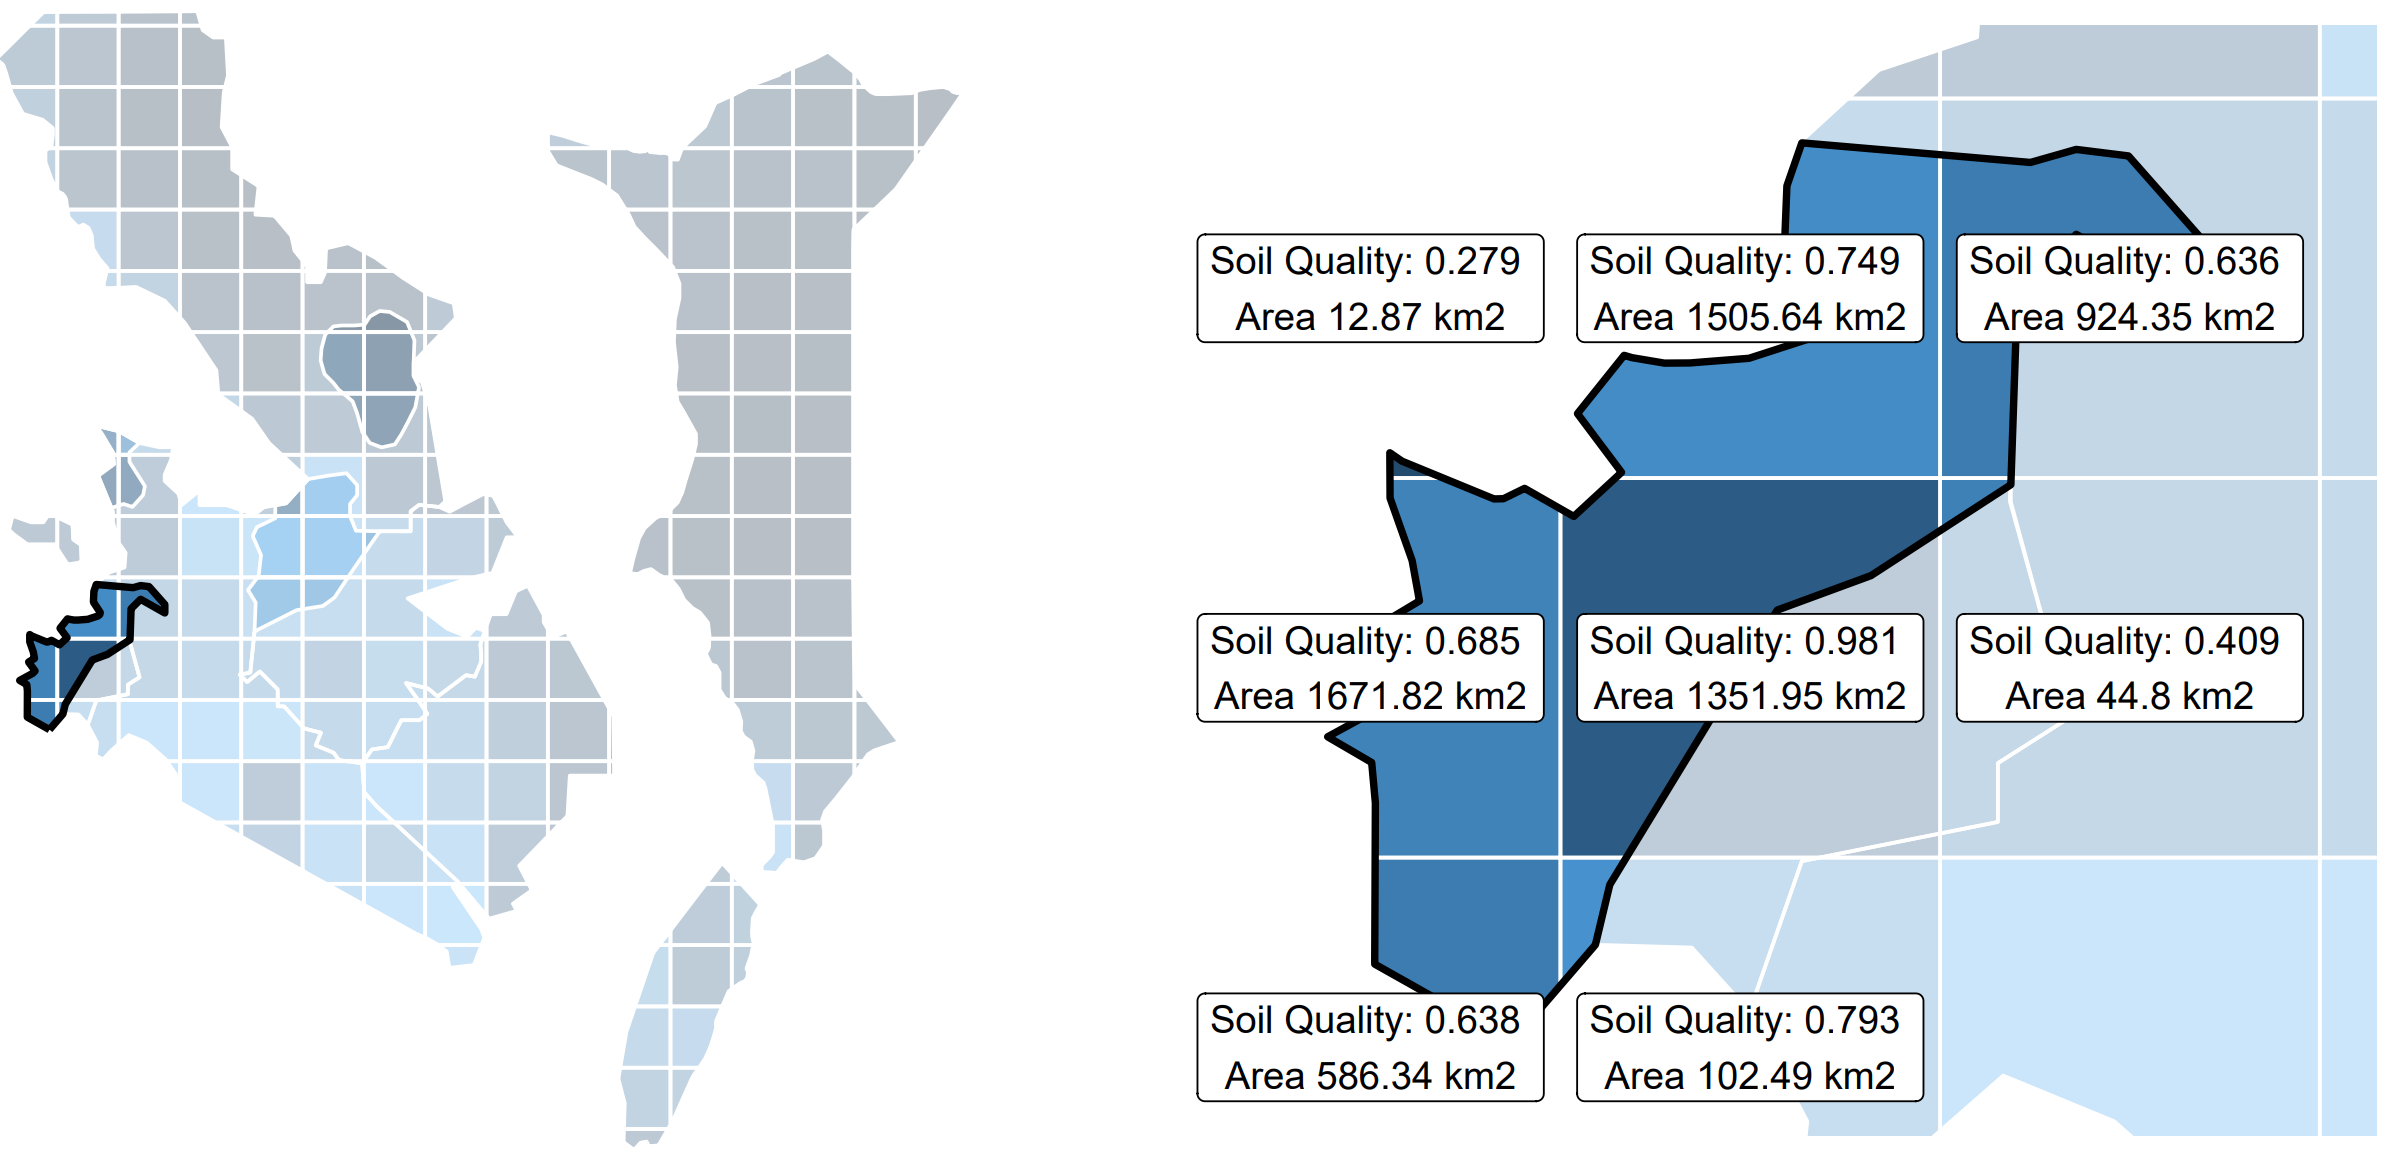
Abstract: Resources matter in political competition, and control of fertile land especially so. In many countries, ethnic groups are the building blocks of political coalitions. We combine these two insights, and argue that an ethnic groups’ control of fertile land — which we call “soil power” — shape their bargaining power in national politics. This in turn shapes national political outcomes. We use satellite and soil data to calculate the cumulative agricultural potential of ethnic homelands in several common datasets. We demonstrate that soil power predicts a groups’ national power and its risk of discrimination, beyond that which can be explained by population share. Using maps of ethnic group homelands as they were in the 1880s and theory from the literature on ethno-linguistic fractionalization, we also evidence and formalize a new deleterious legacy of colonialism: the creation of countries in which the distribution of land resources made governance extremely hard.
Our method for estimating the soil power of ethnic homelands. On the left side, we plot ethnic homeland borders in Kenya in 2017 from GEO-EPR intersected with data on estimated agricultural productivity from Ramankutty et al. (2002). The Luo homeland is given a black border. In the right side plot, we zoom in on the Luo’s homeland, and extract the area they control within the different grid cells, and the estimated agricultural productivity within these cells. In both plots, darker shades indicates more productive land. “Soil quality” here denotes the estimated potential agricultural productivity of the area. It is calculated using a model that incorporates data on the area’s temperature, sunshine hours, rainfall, elevation, slope, and its soil’s carbon density, nitrogen content, pH, water holding capacity, and more.
The seeAI package aims to visualize common machine learning procedures. Visuals are dynamically generated based on supplied models so as to be useful for both teachers/students and practitioners. It currently supports the popular glmnet implementation of cross-validated lasso regression.
AI generating a theory about sport outcomes based on ~500 variables from 5000 matches.AI generating a theory about the whether an email is spam or not based on ~50 variables and 4600 emails.
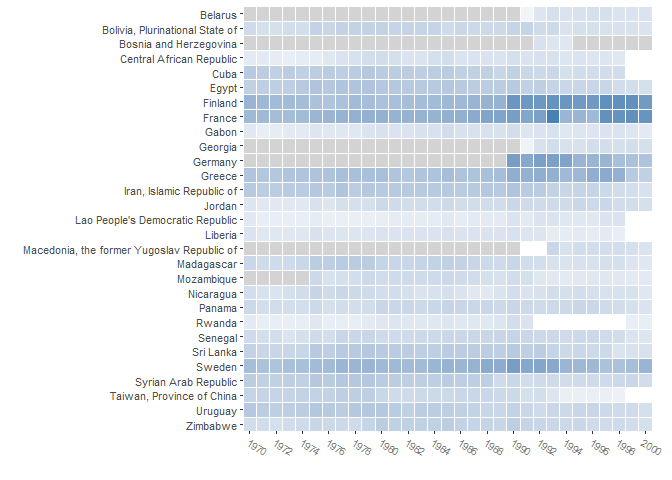
The coverage package and associated function provides you with a summary of your time and unit coverage, producing compact tables and a visual representation. This is important for any analysis conducted with row-wise deletion in the presence of missing data, especially if one suspect that patterns of missingness are non-random with respect to variables of interest. Analysis which use row-wise deletion include standard regression analysis and most implementations of maximum likelihood. See Github for examples and details.
The “out-of-the-box” visual output below shows country and year coverage for a technology-country-year analysis, with darker blue indicating more observations, and grey indicating years in which the unit in question did not exist as an independent country:
The QuickReg package and associated function provides an easy interface for linear regression in R. This includes the option to request robust and clustered standard errors, automatic labeling, an easy way to specify multiple regression specifications simultaneously, and a compact html or latex output (relying on the widely used “stargazer” package).
QuickReg also includes several functionalities to speed up OLS computation, including a special implementation of the method of alternating projections. This method reduces calculation time drastically (>60 percent in tests) for analysis with a large number of fixed effects, with a performance gain that is increasing in the number of regression specifications passed to the function simultaneously.
QuickCoefPlot – Easy OLS coefficient plots with options in R. Available on Github.
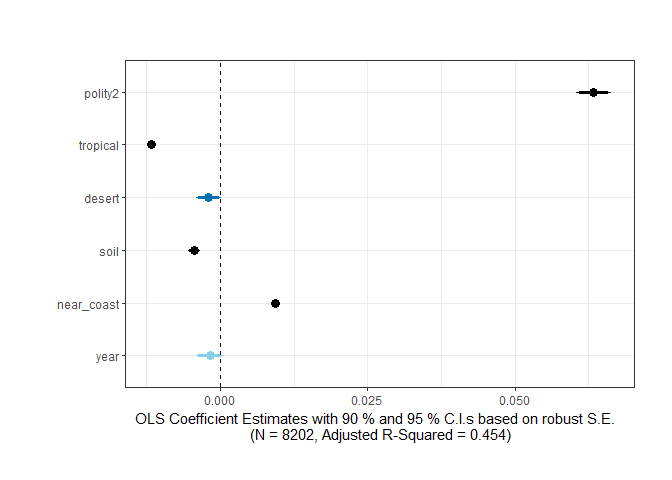
The QuickCoefPlot package turns base R’s linear-model objects into easy-to-read coefficient plots, complete with model statistics, labeling and heteroskedasticity-robust standard errors (by default). Includes a range of options, including the opportunity to request default or clustered standard errors, the option to calculate and report bootstrapped confidence intervals and/or estimates, and change text-size, plot title, which model statistics or coefficients to report, and so on.
# Use the QuickCoefPlot to produce a coefficient plotmodel<- lm(log_gdppc_mad~polity2+tropical+desert+soil+near_coast+year, data=mydata)
qcp(model)
QuickEffectSize – Easy effect size plots with options in R. Available on Github. QuickEffectSize is an easy interface for effect size plots in R. Using the Zelig package and ggplot2, it simulates and visualizes effect sizes of any zelig model: simply supply the model and the variable.
# Produce an effect size plot using QuickEffectSize
dat<-data.frame(y= rnorm(100), x1= rnorm(100), x2= rnorm(100))
dat$x3<-dat$y+ rnorm(100)
example.model<- zelig(y~x1+x2+x3, data=dat, model="normal", cite=FALSE)
qes(example.model, iv.var="x3", xlab="Using qes", ylab="Productivity", progress=FALSE)
Data:
The US Patent Data Set (1976-2015)
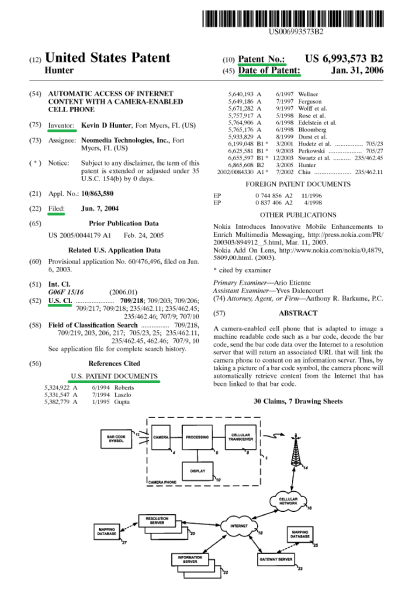
Data Set of all patents granted in the United States between 1976 and 2015, with information on patent class, country and city of inventor, and number of times cited by other patents. Includes 5.9 million patents and 31.6 million associated citations.
Example U.S. patent with information recorded in the US Patent Data Set underlined in green.
The Military Technology Data Set
Country-year adoption rate of 33 military technologies. 105 425 data points at the country-technology-year level.